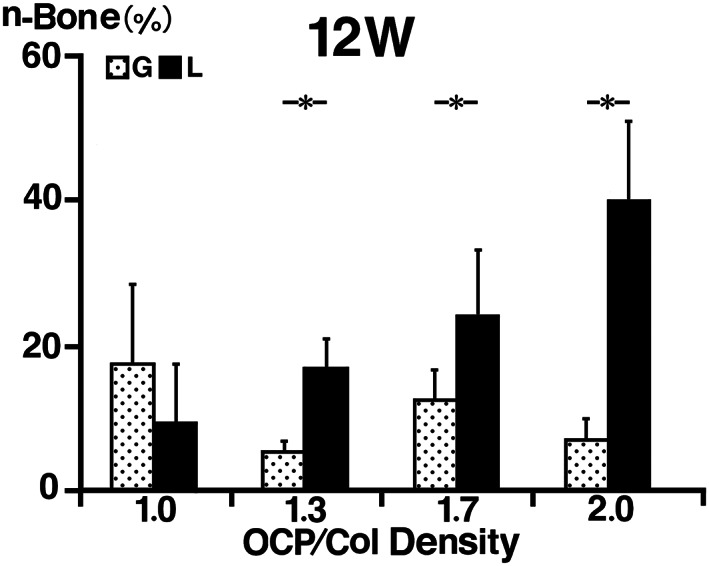
FIGURE 8.

Histomorphometrical examination of the percentage of newly formed bone (n‐Bone%). In the G group, n‐Bone% of the G1.0 was higher than those of G1.3, G1.7, and G2.0, and there was no significant difference among the samples of same density. In the L group, n‐Bone% of the L2.0 was higher than those of L1.7, L1.3, and L1.0, and there was no significant difference among the samples of same density. Compared with same density of octacalcium phosphate and collagen composite (OCP/Col), the n‐Bone% at 12 weeks of L group samples was higher than those of G group samples with the exception of OCP/Col density of 1.0
