Figure 4.

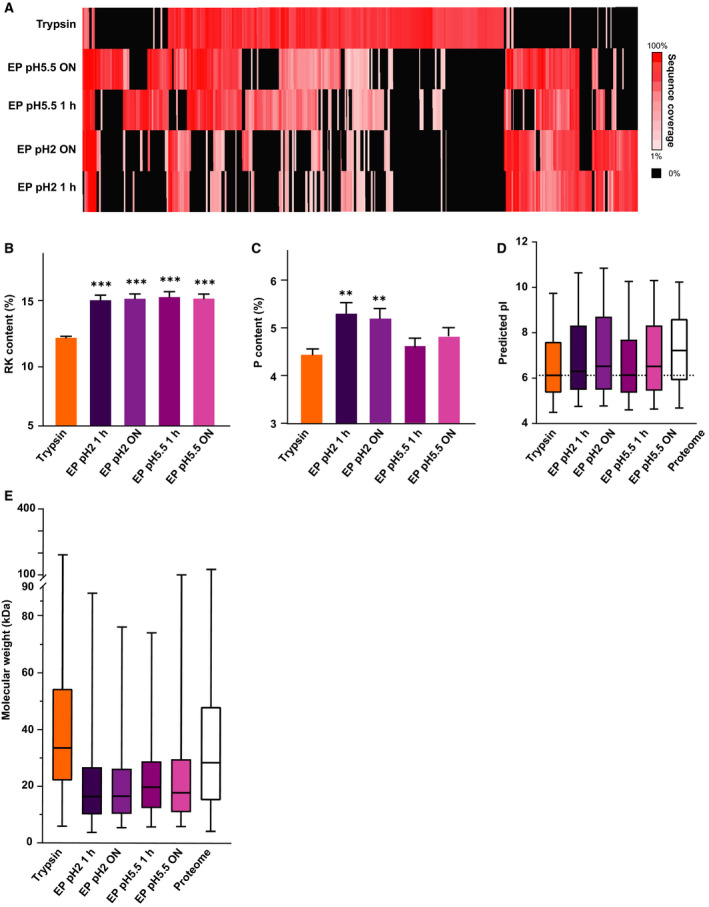
Proteome Characteristics. (A) Comparison of the sequence coverage achieved by using trypsin and EndoPro (the latter under 4 different digestion conditions) for in total 380 selected proteins. Only these 380 proteins showing at least 50% more sequence coverage in one of the datasets were considered in B–E. For clarity, proteins for which the two proteases performed comparably were not included. Black indicates no coverage of a protein in a certain condition. (B) Comparison of the arginine and/or lysine content, which is significantly higher in EndoPro peptides. (C–E) Comparison of the proline content (C), isoelectric point (D), and molecular weight (E) of proteins identified using EndoPro (at 4 different conditions) or trypsin. Notably, as shown in (E) EndoPro favors smaller proteins; trypsin shows a bias for larger proteins. Significance was determined using one‐way ANOVA, with α = 0.05. **P < 0.01, and ***P < 0.001; error bars represent SEM.
