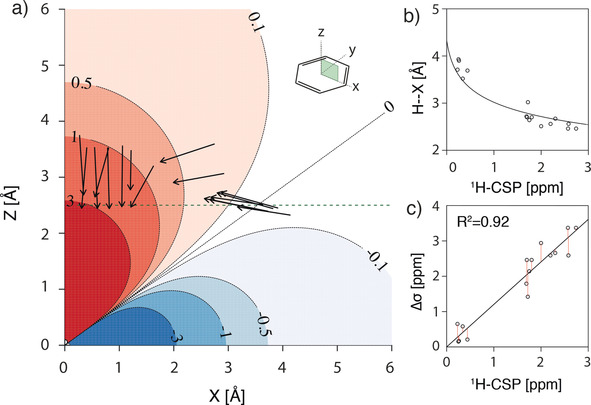
Figure 4.

a) Black arrows represent the projections of the CH bond vectors for tryptophan CH groups interacting with ligand aromatic ring systems of ligands 2 to 13 onto the x−z=y−z plane of the calculated isotropic shielding surface Δσ(r,θ) in ppm. Individual conformational parameters are shown in Table S1 in the Supporting Information. The green dashed line corresponds to the most frequently found H–Y distance of 2.5 Å. b) Comparison between calculated chemical shifts and their dependence on the proton‐to‐ring‐center distance (H–X). In the calculation (solid line) the H–Y distance was set to 2.5 Å. c) Correlation of CSP with the calculated nuclear shielding constant Δσ. Calculated values for Δσ from X‐ray crystal structures are well reproduced by experimental data (R2=0.92).
