
Figure 2.
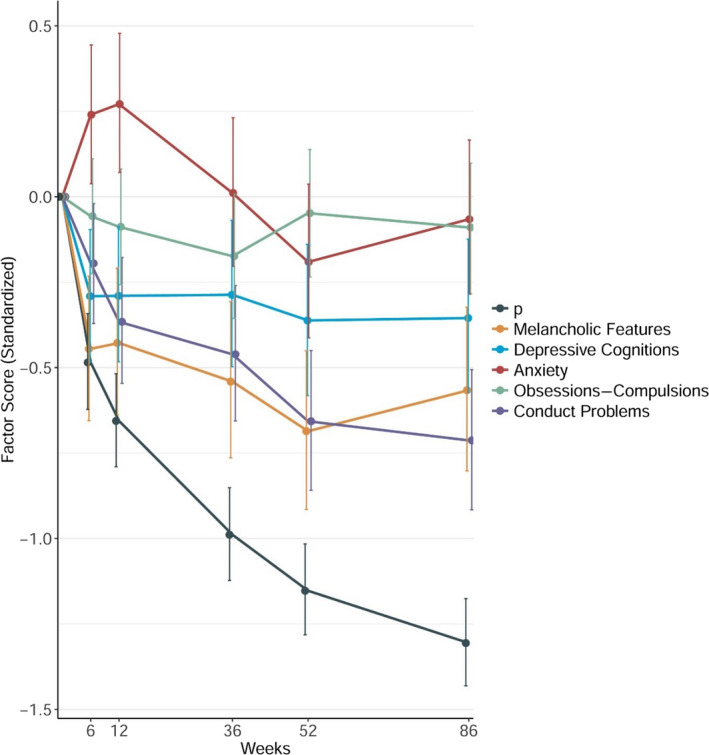
General and specific factor scores across treatment and follow‐up. Error bars represent the 95% Bayes credibility interval. Factors are derived from orthogonal bifactor modeling, in which each item loads on the general p factor has its remaining variance accounted for by one of the five specific factors [Colour figure can be viewed at wileyonlinelibrary.com]