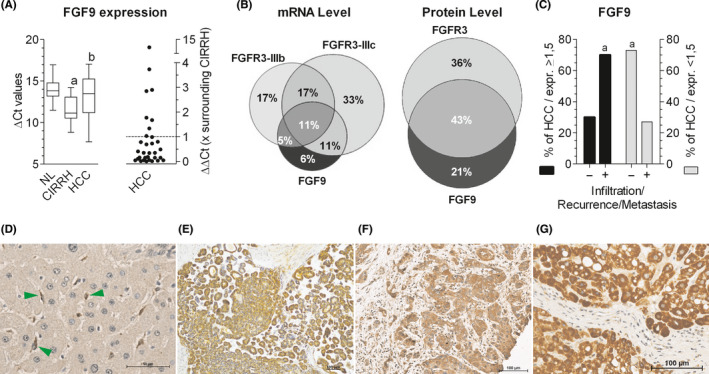
FIGURE 3.

Frequent co‐occurrence of upregulated FGF9 and FGFR3 in hepatocellular carcinoma: possible implications for infiltrative growth. (A, left panel), FGF9 mRNA levels were determined by RT‐qPCR for normal (NL) or cirrhotic livers (CIRRH) and hepatocellular carcinoma (HCC). (A, right panel), mRNA levels of individual HCC samples were expressed as ‐fold surrounding (non‐tumour) liver tissue, obtained from the same patient: values > 1 indicate a higher expression level in HCC than in surrounding tissue. (B), Venn diagrams show HCC cases with upregulation of FGF9, FGFR3‐IIIb and/or FGFR3‐IIIc at the mRNA level (set 100%; left panel) and of FGF9 and/or FGFR3 at the protein level (set 100%; right panel). (C), Black bars stand for all HCC cases with overexpression of FGF9 protein (set 100%), grey bars give all HCC cases without overexpression of FGF9 protein (set 100%). Within these two categories, cases were grouped according to: ‐, no local invasion and/or metastasis at the time point of resection and/or no recurrence within 82 ± 20 months of follow‐up; +, local invasion and/or metastasis at the time point of resection and/or recurrence within 9 ± 17 months of follow‐up. Further detail see Table S1. FGF9 immunostains of paraffin‐embedded tissue sections: (D), Unaltered liver with FGF9‐positive mesenchymal cells (green arrows); (E‐G), Details of HCC tissue of three different cases. (A), Boxplot: whiskers at minimum and maximum, box at 25th percentile and 75th percentile with a line at 50th percentile. Statistics by unpaired t‐test for NL vs CIRRH: a, P < .01; for CIRRH vs HCC: b, P < .05. Statistics in (C) by Chi‐square test: a, P < .05
