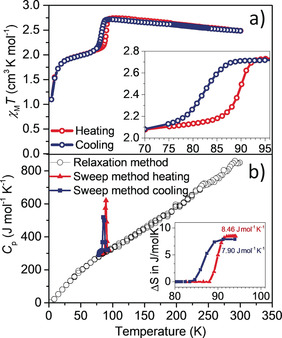
Figure 1.

a) Plot of χ M T versus T for complex 1 in cooling (blue curve) and heating (red curve) modes between 4 and 300 K measured at 0.1 T. Inset: 8 K wide hysteretic transition. b) Heat capacity, Cp, versus T of a single crystal of complex 1 measured by two methods, the relaxation method (black circles) and the temperature sweep method (red line, warming; blue line, cooling). The temperature sweep method is sensitive to sharp changes such as first order phase transitions, whereas the relaxation method more accurately determines the magnitude of the heat capacity where it is smoothly varying with temperature. Inset: Entropy change ΔS determined from integration of the peak in the heat capacity: 7.90 J mol−1 K−1 on cooling and 8.46 J mol−1 K−1 on heating.
