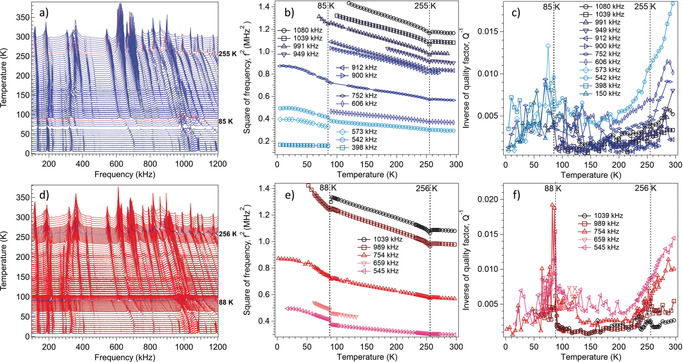
Figure 4.

a,d) RUS spectra as a function of frequency for a single crystal of complex 1, stacked up the y‐axis in proportion to the temperature at which they were collected. The y‐axis is really amplitude in volts but has been relabelled as temperature. Spectra were collected during (a) cooling and (d) heating between circa 295 K and circa 4 K. The highlighted red lines (cooling) and blue lines (heating) indicate the expected location of the transitions at circa 255 K and circa 85 K. b,e) f 2 and c,f) Q −1 data from fitting of selected resonances with an asymmetric Lorentzian function, showing the continuous structural phase transition at circa 255 K and the discontinuous transition at circa 85 K.
