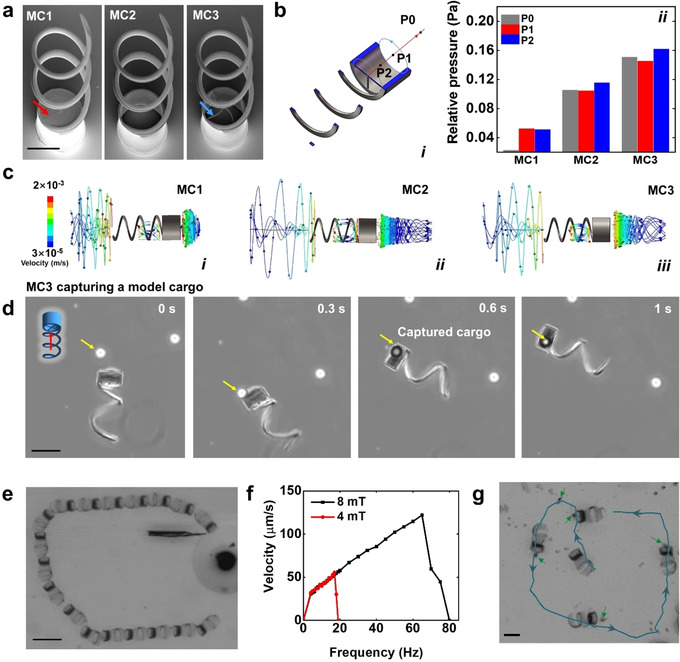
Figure 1.

a) SEM images of three microcarrier designs (MC1, MC2, and MC3). Scale bar: 50 μm. Red arrow points at the bottom of MC1 and blue arrow points at the cross structure of MC3. b) Relative pressure of MCs: (i) Positions of three analyzed relative pressures. P0: 40 μm away from P1 along swimming direction; P1: center of the top opening of the cylinder; P2: 20 μm from P2 along the reverse direction of swimming. Blue arrow circles indicate the rotation of MCs. Red arrow line indicates the swimming direction. (ii) Relative pressure for the three different prototypes. c) Flow trajectories showing the fluid vortex of the three prototypes of MCs. Color bar indicates flow velocity (m s−1). Prototype with a trapping front cavity in form of: (i) cylinder with a solid bottom surface, (ii) hollow cylinder, and (iii) cylinder with a cross‐like bottom surface (parameters of the simulation can be found in the Supporting Information). d) MC3 capturing a model cargo (a 40 μm polystyrene particle). Scale bar 50 μm. e) Motion sequence of MC3 guided in a rectangular track. Scale bar: 200 μm. (f) Swimming velocity of MC3 at two magnetic field strengths (4 and 8 mT), in the frequency range from 0 to 80 Hz. g) Overlaid motion sequence and track of the transport of a cluster of immotile sperms by MC3. Blue line and arrows depict the track and directions of the MC movement. Green arrows point at the cluster of immotile sperms. Scale bar: 50 μm.
