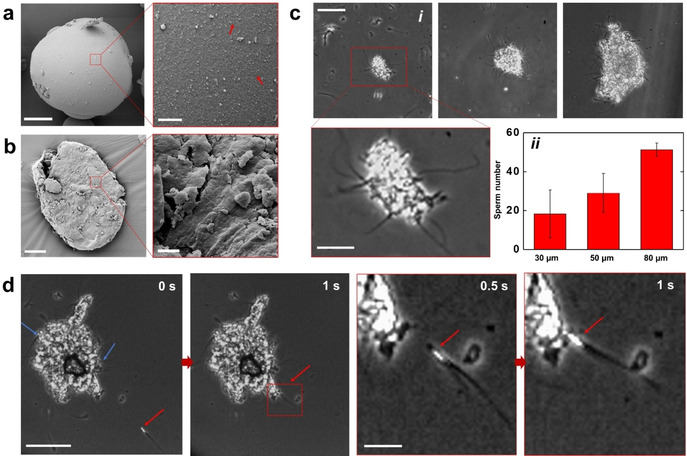
Figure 3.

a) SEM image of a BSA‐HA microbead. Red arrows point at the HA particles (<1 μm size). Scale bar: 20 μm in the low magnification image and 2 μm in the magnified image. b) SEM image of the resulting microflake after milling the microbead of Figure a. Scale bar: 20 μm in the low magnification image and 2 μm in the magnified image. c) Sperm immobilization on microflakes of different sizes. (i) Optical microscopy images. Scale bar: 50 μm; 20 μm in the magnified image. (ii) Sperm number related to the microflake size (n=3). d) Image sequence showing the sperm capturing on a microflake. Red arrows point at one sperm before and after being captured. Blue arrows point at the already immobilized sperm. Scale bar: 50 μm.
