
Figure 4.
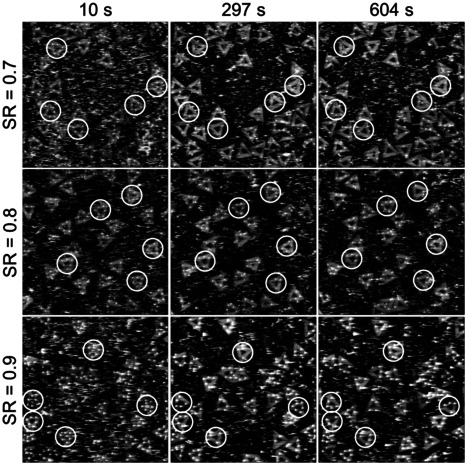
Selected HS‐AFM images (1×1 μm2) recorded at an amplitude of 3.3 nm, LR=50 Hz, a resolution of 512×512 px2, and three different SRs. White circles indicate the DNA origami used in the determination of the average binding yields shown in Figure 3.