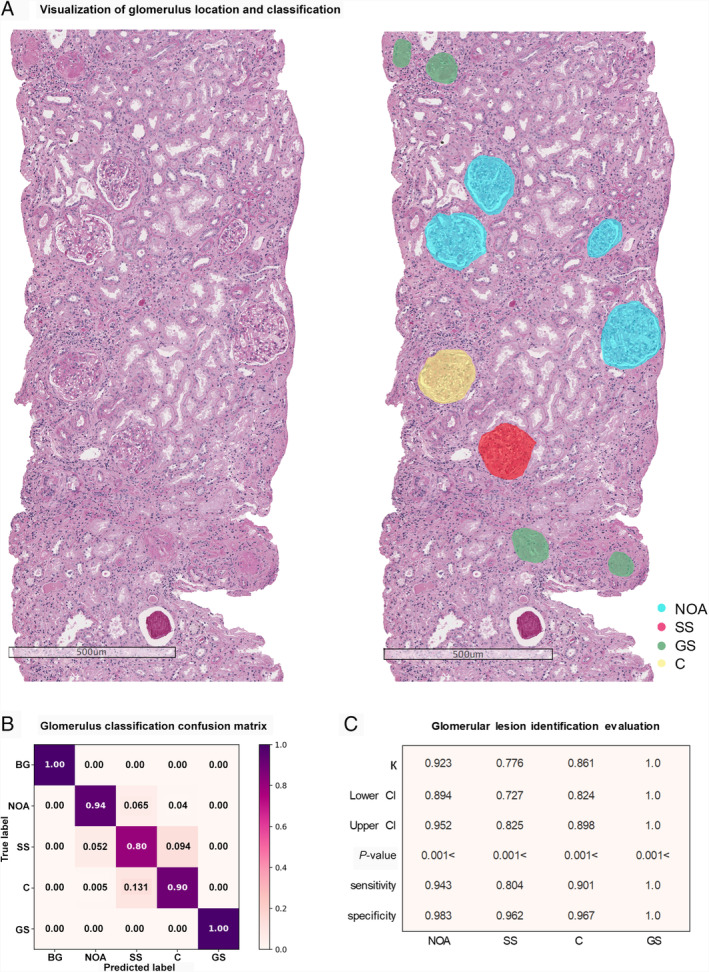
Figure 2.

Assessment of glomerular lesion identification. (A) Visualization of location and classification of glomeruli with PAS stain. (B) Glomerular lesion classification confusion matrix, which provides the condition of how predictions are distributed over subcategories. (C) Metrics of the classification task, with Cohen's kappa, 95% confidence interval score, P value, sensitivity, and specificity.
