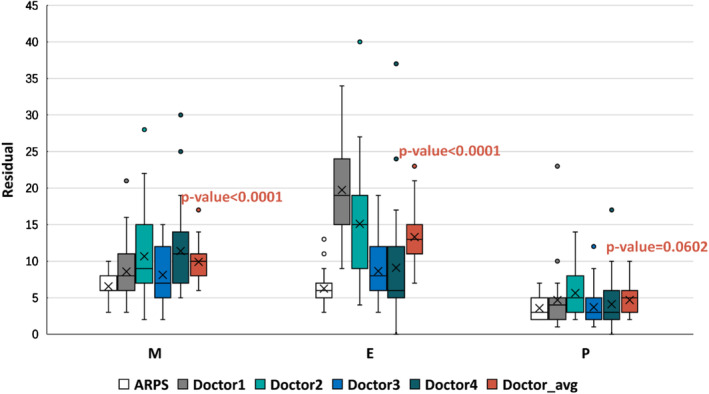
Figure 4.

Boxplot of the residual map in the intrinsic glomerular cell recognition task. The horizontal axis represents the ground truth, while the vertical axis indicates the residual between the competitors (ARPS and four doctors) and ground truth (senior pathologists). The horizontal lines from top to bottom in each boxplot represent the maximum, third quartile, median, first quartile, and minimum, respectively, and the cross represents the mean value of residual.
