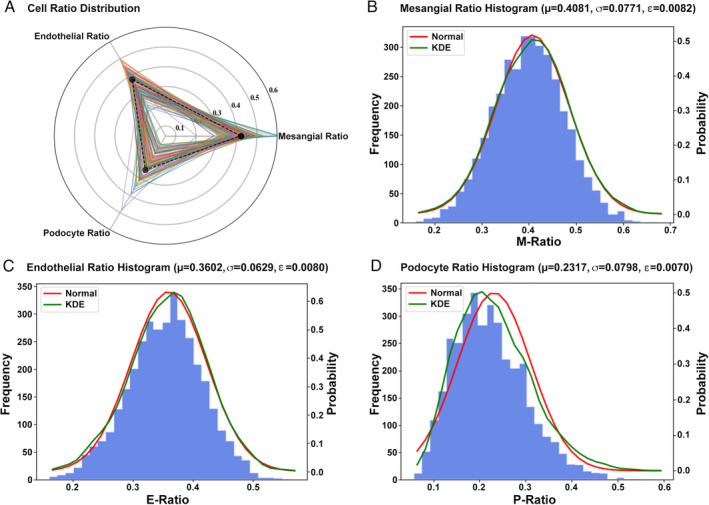
Figure 5.

Distribution of intrinsic glomerular cells. (A) Distribution map of three kinds of intrinsic glomerular cells. (B–D) Histogram of mesangial cells, endothelial cells, and podocytes, respectively. The kernel density estimation (KDE, green line) represents the real distribution, while the red line indicates the normal distribution.
