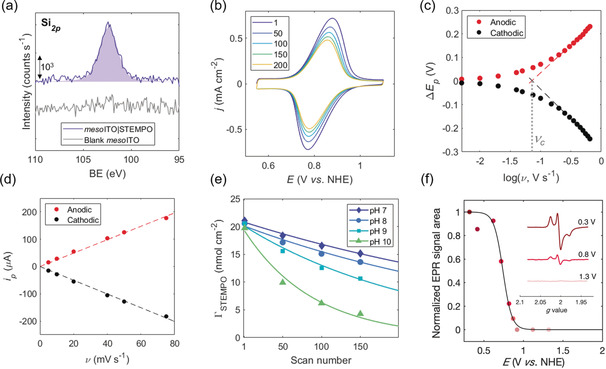
Figure 2.

Characterization of mesoITO|STEMPO, assembled under optimized conditions. a) Si2p XPS spectrum of mesoITO|STEMPO. b) Multi‐scan CV, conditions: pH 8 aq. HCO3 −/CO3 2− (0.2 m), ν=50 mV s−1, N2, r.t. (legend denotes scan number). c) Trumpet plot deduced from the variable scan rate CV measurements; conditions: pH 8 aq. HCO3 −/CO3 2− (0.5 m), N2, r.t. d) ip vs. ν plot, for ν<νc. e) Stability curves as a function of pH (data fitted to a mono‐exponential decay), formulated by tracing the change in ΓSTEMPO (obtained through integration of the oxidation wave in the CV) over scan number in the multi‐scan CV experiment. f) FE‐EPR potentiometric titration of C‐mesoITO|STEMPO. Peak area of the STEMPO EPR signal as a function of potential (colored dots), fitted to 1 e− Nernst equation (solid line). Inset: X‐band (9.5 GHz) EPR spectra of STEMPO at different applied potentials. Measurements performed at 100 K, 2 mW microwave power, 100 kHz modulation frequency and 2 G modulation amplitude.
