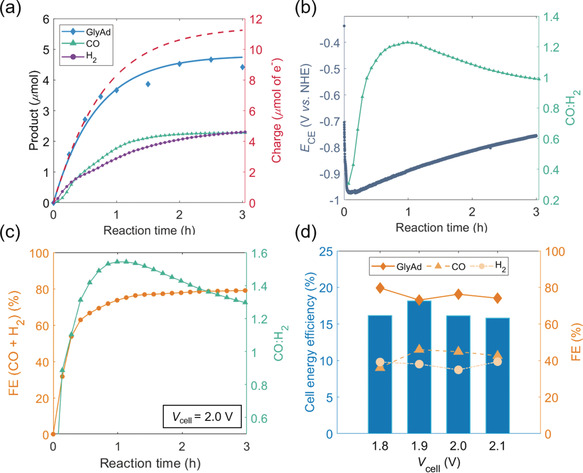
Figure 5.

a) Similar profile to that shown in Figure 4 c, but using glycerol as the substrate (Eapp (anode)=1.0 V vs. NHE). b) Trend in the CO:H2 ratio and CE (i.e. CP|CNT‐CoPPc) potential (E CE) over reaction time. c) Combined FE for CO and H2, and CO:H2 ratio for the two‐electrode configuration employing glycerol as the substrate (applied cell potential=2.0 V). d) Cell energy efficiency and FE plotted as a function of V cell in the same two‐electrode setup. Conditions: for both the three‐electrode (plots (a) and (b)), and two‐electrode (plots (c) and (d)) configurations, a two‐compartment cell (fitted with anion‐exchange membrane) was used; anode compartment: N2 saturated pH 8.3 aq. HCO3 −/CO3 2− (0.5 m); cathode compartment: CO2 saturated pH 7.3 aq. HCO3 −/CO3 2− (0.5 m); glycerol substrate (50 mm) present in anodic compartment, t CPE=3 h, r.t. Glycerol oxidation and gaseous products quantified by HPLC and continuous flow GC analysis, respectively.
