
Figure 7.
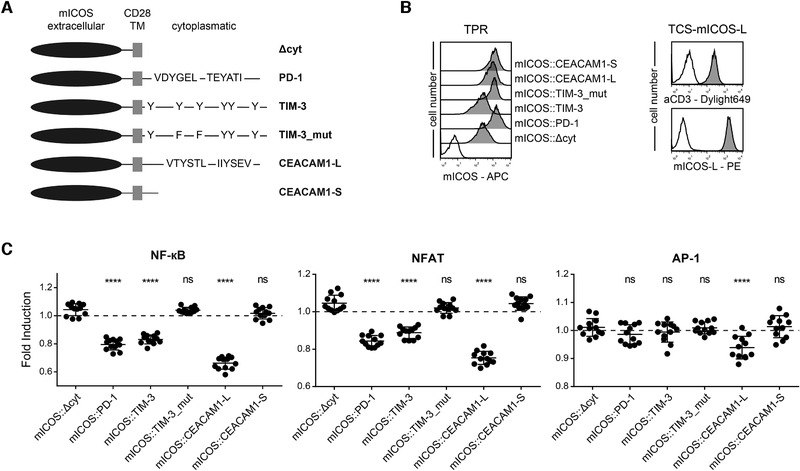
Cytoplasmic sequences of TIM‐3 and CEACAM1 induce inhibitory signals. (A) Schematic of mICOS chimera; (B) Left: surface expression of mICOS::Δcyt, mICOS::PD‐1, mICOS::TIM‐3, mICOS::TIM‐3_mut, mICOS::CEACAM1‐L, and mICOS::CEACAM1‐S on TPR cells (dark gray histograms). Reactivity of mICOS Ab with control TPR is shown as an open histogram. Right: Flow cytometry analysis of TCS‐mICOS‐L. Open histograms: control cells; filled histograms: expression of indicated molecules. (C) mICOS::Δcyt, mICOS::PD‐1, mICOS::TIM‐3, mICOS::TIM‐3_mut, mICOS::CEACAM1‐L, and mICOS::CEACAM1‐S reporter cells were stimulated with control TCS or TCS‐expressing mICOS‐L. For statistical evaluation, one‐way ANOVA followed by Dunnett's test was performed (****p ≤ 0.0001; ns, p > 0.05). eGFP, eCFP, and mCherry expression was measured via flow cytometry. Results are shown for four independent experiments performed in triplicates. Reporter activation is shown as fold induction (gMFI of mICOS‐L‐stimulated cells/gMFI of control‐stimulated cells). It should be noted that some data pointes overlap. Control stimulation is shown as a dotted line.