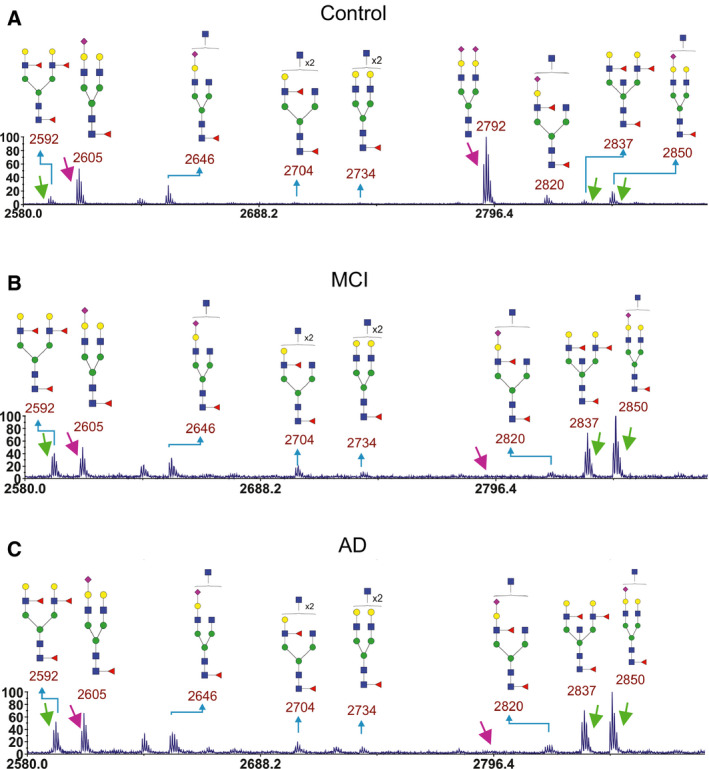
Figure 2.

Parts of MALDI‐TOF mass spectra of permethylated CSF‐derived N‐glycans in CSF samples. Results from pooled CSF samples from (A) control (n = 31), (B) MCI (n = 27), and (C) AD (n = 25) are shown. Arrows point at peaks used for ratio calculations of different glycans. Green arrows point at peaks that were increased in MCI and AD compared to control. Magenta arrows point at peaks that were decreased in MCI and AD compared to control.
