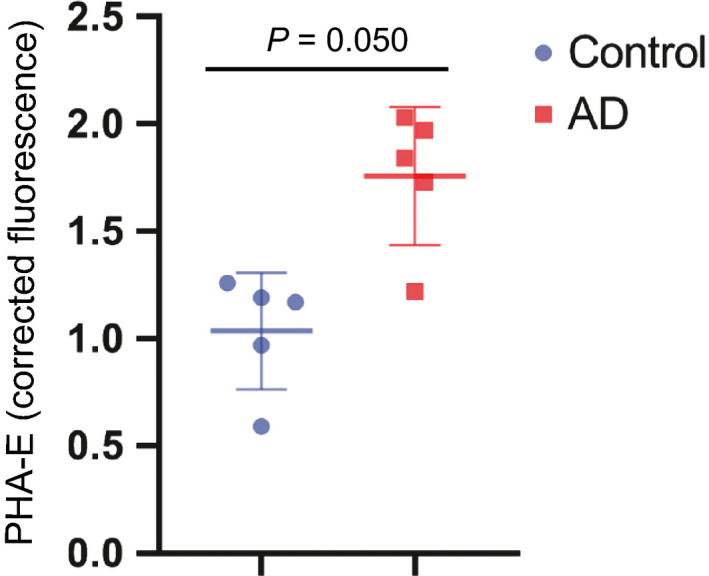
Figure 7.

PHA‐E binding to CSF glycoproteins in control and AD cases. Corrected fluorescence signal obtained from ELLA was plotted for replicates of single individuals in control (n = 5) and AD (n = 5) samples from the Clinical Neurochemistry Laboratory. Lines represent mean values ± SD. Significance between the groups was calculated using two‐tailed unpaired Student’s t‐test.
