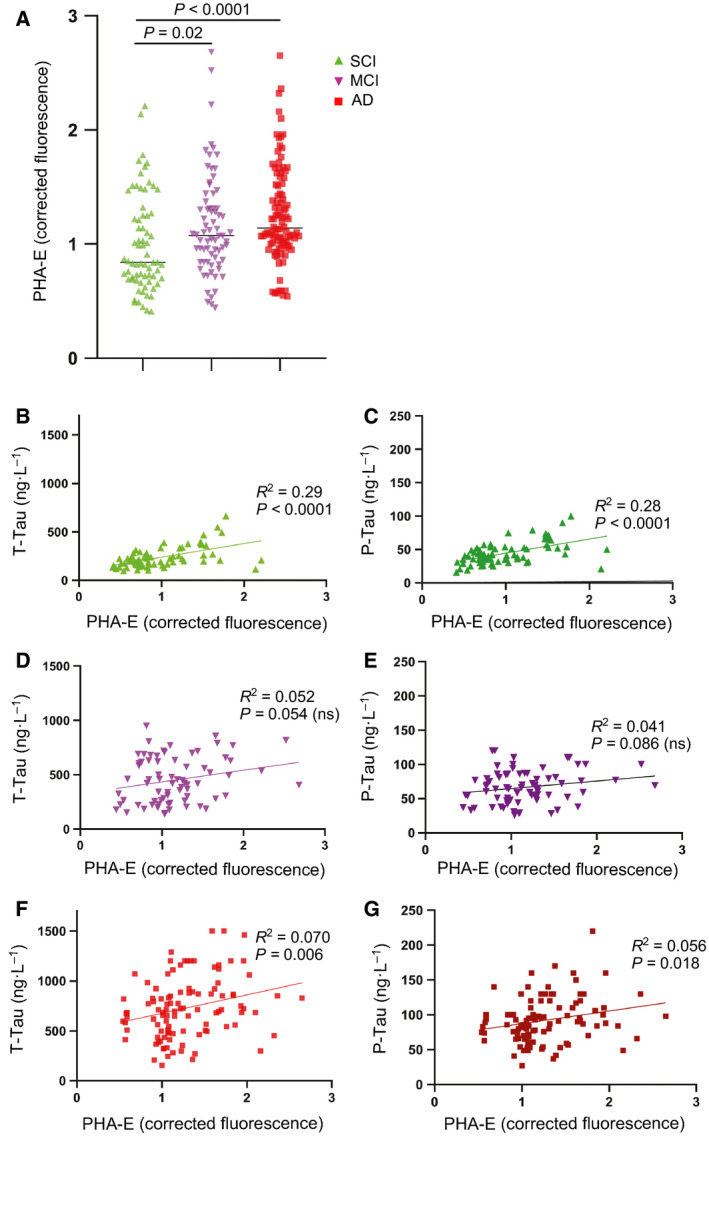
Figure 8.

PHA‐E binding to CSF glycoproteins in different patient groups. (A) Corrected fluorescence signal obtained from ELLA was plotted for replicates of single individuals in SCI (n = 70), MCI (n = 72), and AD (n = 100) samples from the GEDOC registry. Significance between the groups was calculated using two‐tailed unpaired Student’s t‐test. (B, C) Plots of CSF tau levels vs PHA‐E binding in the SCI group. (D, E) Plots of CSF tau levels vs PHA‐E binding in the MCI group. (F, G) Plots of CSF tau levels vs PHA‐E binding in the AD group. Correlation was determined by calculating R 2 and P values by linear regression in graphpad prism.
