FIGURE 4.

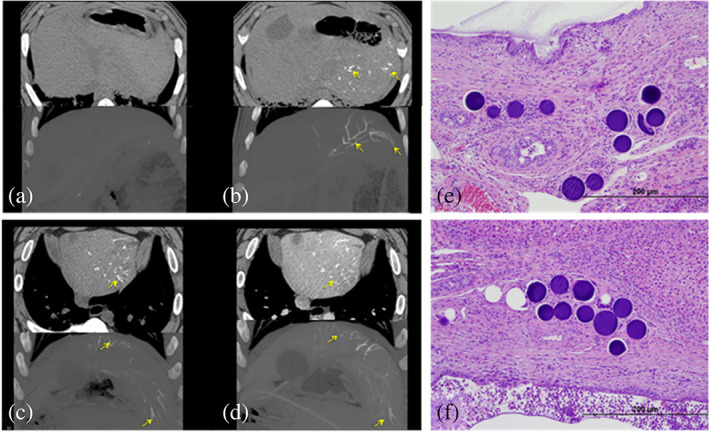
Multi Detector Computed Tomography (MDCT) (top) and maximum intensity projection (MIP) (bottom) imaging findings for LUMI40‐90 (a) pre‐embolization non‐contrast CT images showing no abnormal observations in the liver. (b) Non‐contrast CT images immediately post‐embolization showing presence of LUMI40‐90 in the main arteries of liver left lobe. (c) Non‐contrast and (d) IV contrast‐enhanced CT imaging 90 days post‐embolization with LUMI40‐90 still clearly visible, even in smaller more distal arteries. (e, f) typical histological sections containing LUMI40‐90 microspheres (stained purple) embedded within tissue within the remodeled artery with the occasional instance of inflammatory cells contacting the microsphere surface
