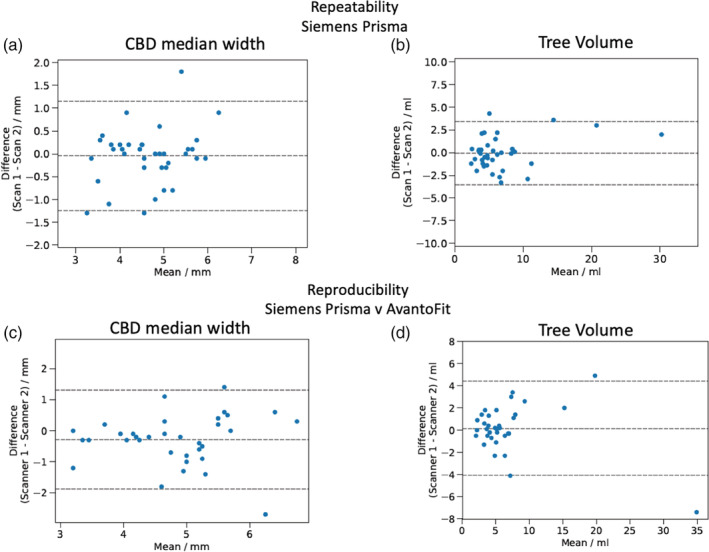
Figure 5.

Bland–Altman scatterplots reveal moderate repeatability of biliary tree metrics with examples shown for (a) the CBD median (0.0 mm bias, –1.2 – 1.1 mm LoA, RC = ±1.7 mm) and (b) total biliary tree volume (–0.1 mL bias, –3.5 – 3.4 mL LoA, RC = ±2.2 mL). Reproducibility of quantitative MRCP comparing the results between Siemens Prisma and Siemens AvantoFit in both (c) the CBD median (–0.3 mm bias, –1.9 – 1.3 LoA, RC = ±2.3 mm) and (d) total tree volume (0.2 mL bias, –4.1 – 4.4 mL LoA, RC = ±4.9 mL).
