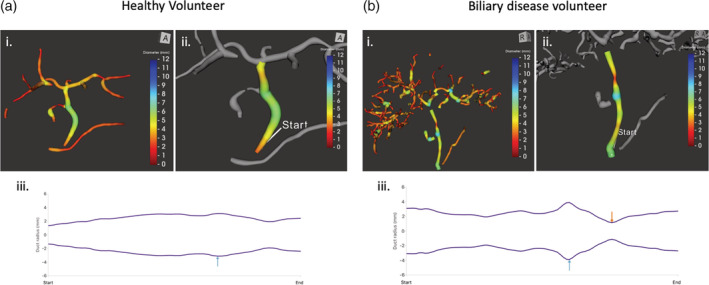
Figure 6.

Comparison of healthy and biliary diseased patients (a) healthy participant (i) total tree volume of 4.1 mL, (ii) isolation and analysis of the CBD, with quantitative results: Median: 5.2 Min 2.7 mm Max 6.2 IQR 4.1–5.8, (iii) CBD diameter profile revealing slight increase (>30%) at blue arrow. (b) Participant with biliary disease, (i) total tree volume 22.2 mL, (ii) isolation and analysis of the CBD, with quantitative results: Median 4.8, Min 2.3 Max 7.8, IQR 4.4–5.8, (iii) CBD diameter profile revealing a stricture (blue) and apparent dilatation (orange).
