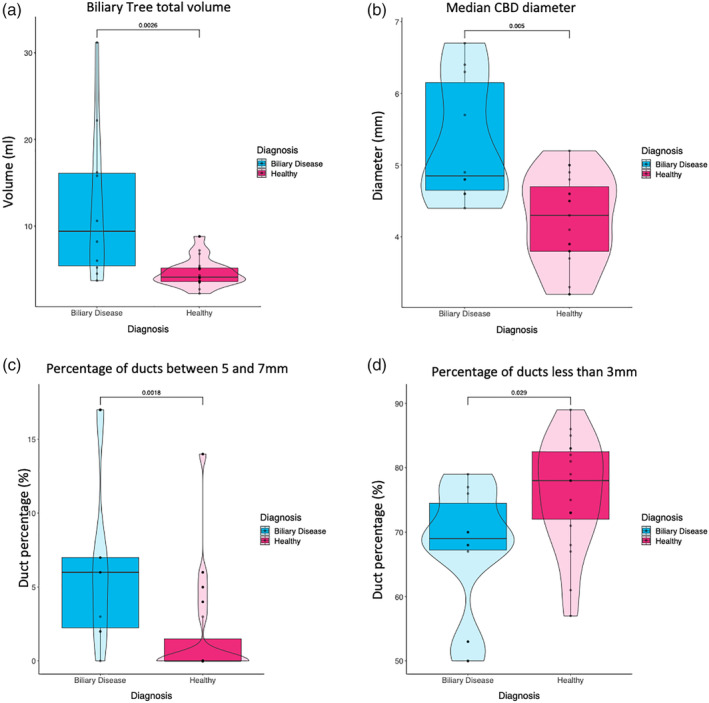
Figure 7.

(a) Total biliary tree volume analysis revealed biliary diseased patients to have a larger overall biliary tree compared to healthy volunteers (P = 0.0026). (b) The CBD of individuals with biliary disease were found to be significantly larger than the healthy volunteers (P = 0.005). (c) The total percentage of ducts in the biliary tree whose diameter was between 5–7 mm were significantly increased in individuals with biliary disease (P = 0.0018), (d) whereas the total percentage of ducts in the biliary tree with a diameter of less than 3 mm were found to be significantly greater in healthy volunteers (P = 0.029).
