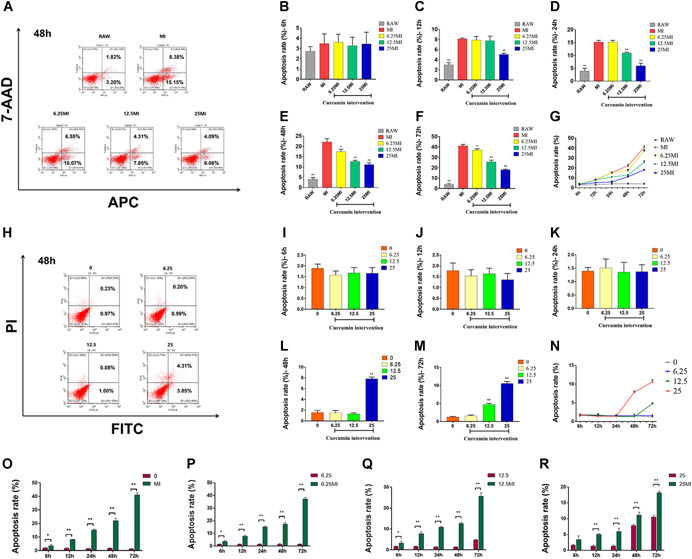
Figure 4.

A, Representative figure of flow cytometric analysis of osteocyte apoptosis after 48 hours of intervention with CM from each group. B‐G, Quantitative analysis of osteocyte apoptosis after 6, 12, 24, 48, and 72 hours intervention with CM from each group. H, Representative figure of flow cytometric analysis of osteocyte apoptosis after 48 hours of intervention with different concentrations of curcumin. I‐N, Quantitative analysis of osteocyte apoptosis after 6, 12, 24, 48, and 72 hours intervention with different concentrations of curcumin. O‐R, Comparative analysis of the effects of CM from each group and different concentrations of curcumin on osteocyte apoptosis. The data are expressed as the mean ± SD of three independent experiments. *P < .05, and **P < .01 compared with MI (B‐F); *P < .05 and **P < .01 compared with group 0 (I‐M). CM, conditioned medium [Color figure can be viewed at wileyonlinelibrary.com]
