
Figure 3.
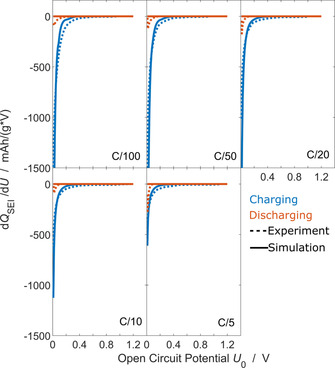
Consumed SEI capacity during the second cycle as function of OCV for different applied j=C/100, C/50, C/20, C/10, C/5. We compare experiments57 (dashed) and simulation results [solid, Eq. (30)]. Charging is depicted in blue, discharging in orange.