
Figure 4.
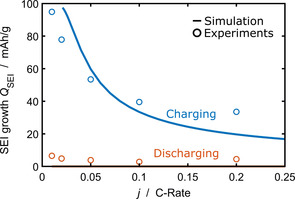
Current dependence of the overall SEI charge during the second cycle. We compare experiments57 (circles) and simulation results [line, Eq. (31)]. Charging is depicted in blue, discharging in orange.
Official websites use .gov
A
.gov website belongs to an official
government organization in the United States.
Secure .gov websites use HTTPS
A lock (
) or https:// means you've safely
connected to the .gov website. Share sensitive
information only on official, secure websites.
Current dependence of the overall SEI charge during the second cycle. We compare experiments57 (circles) and simulation results [line, Eq. (31)]. Charging is depicted in blue, discharging in orange.