
Figure 5.
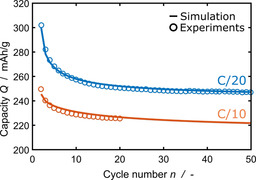
Development of the overall charge consumed for SEI formation over several cycles. We compare experiments57 (circles) and simulation results [solid lines, Eq. (31)]. C/20 in blue, C/10 in orange.
Official websites use .gov
A
.gov website belongs to an official
government organization in the United States.
Secure .gov websites use HTTPS
A lock (
) or https:// means you've safely
connected to the .gov website. Share sensitive
information only on official, secure websites.
Development of the overall charge consumed for SEI formation over several cycles. We compare experiments57 (circles) and simulation results [solid lines, Eq. (31)]. C/20 in blue, C/10 in orange.