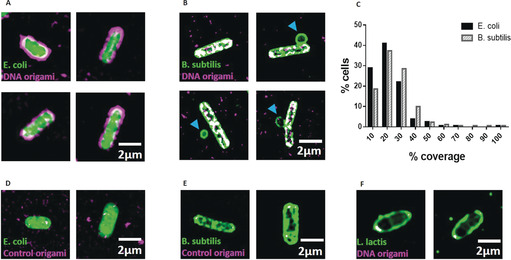
Figure 3.

a) SIM imaging demonstrates that DNA origami binds to E. coli. DNA origami is magenta and GFP‐expressing E. coli are green, while the overlapping areas are in white. b) SIM imaging demonstrating that DNA origami binds to B. subtilis. DNA origami is magenta and B. subtilis green, with overlapping areas in white. c) The mean coverage for E. coli is 18.6 %, and 22.5 % for B. subtilis. d) E. coli and e) B. subtilis that were incubated with DNA origami that did not carry aptamers. f) SIM image of L. lactis incubated with aptamer‐functionalized DNA origami.
