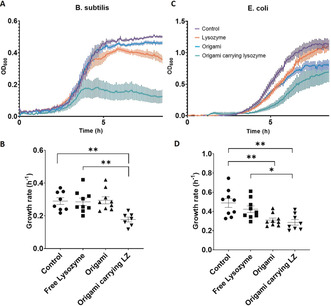
Figure 4.

a) Averaged growth curves for B. subtilis (n=9). b) Growth rate analysis for B. subtilis. c) Averaged growth curves for E. coli (n=9). d) Growth rate analysis for E. coli. All the origami nanostructures used in those experiments were functionalized with aptamers. Error bars in each graph represent the standard error of the means.
