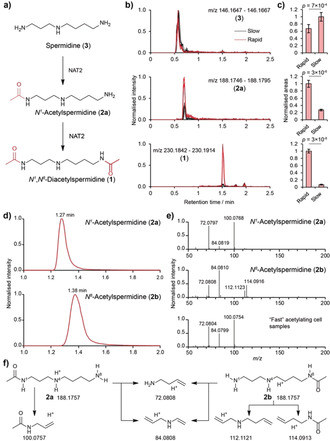
Figure 2.

a) Mass spectrometric analysis of acetylation of spermidine (3) to form N 1‐acetylspermidine (2 a) and diacetylspermidine (1) in cell lines. b,c) Extracted ion chromatograms (EICs) and peak areas [Welch's t‐test (N=6)]. d) EICs for the N 1‐ (2 a) and N 8‐acetylated (2 b) isomers of spermidine. e) Comparison of MS/MS fragmentation pattern of synthetic 2 a/2 b and cell extracts. f) Annotated MS fragments for 2 a/2 b.
