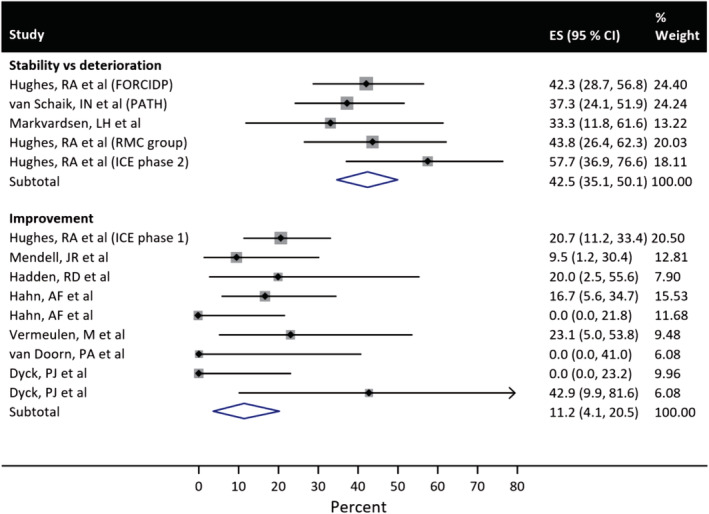
FIGURE 2.

Forest plots from the meta‐analysis showing improvement in placebo subjects in the improvement endpoint studies (n = 9) and non‐deterioration in placebo subjects in the stability vs deterioration endpoint studies (n = 5). CI, confidence interval; ES, effect size
