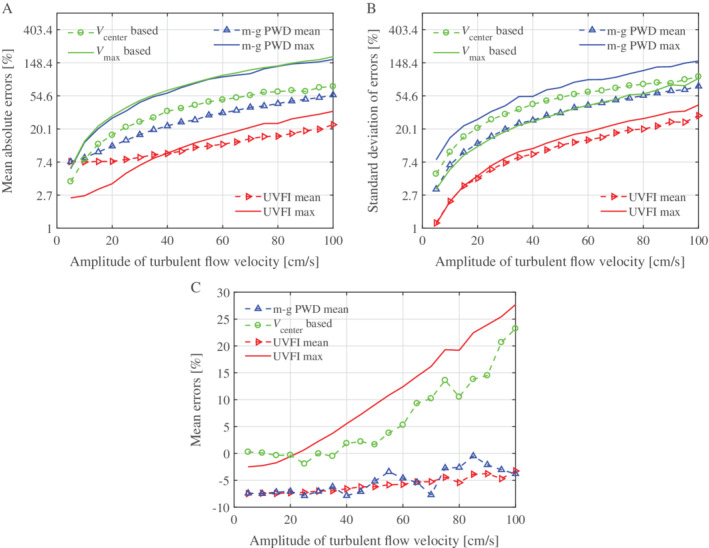
Figure 6.

Errors and standard deviations of the simulated results based on UVFI and PWD, mean absolute errors (A), standard deviation of errors (B), and mean errors (C) for different amplitudes of turbulent flow velocities. Note that the values in A and B are shown in logarithmic (ln) coordinates. For V center based, the velocity at the vessel center is used in Equation 4 to calculate WSS; V max based, the maximum velocity along the vessel diameter is used in Equation 4 to calculate WSS; m‐g PWD mean, WSS is calculated by multigate PWD using Equation 5; m‐g PWD max, WSS is calculated by multigate PWD using Equation 6, multiplying by μ; UVFI mean, WSS is calculated by UVFI using Equation 7; and UVFI max, WSS is calculated by UVFI using Equation 8.
