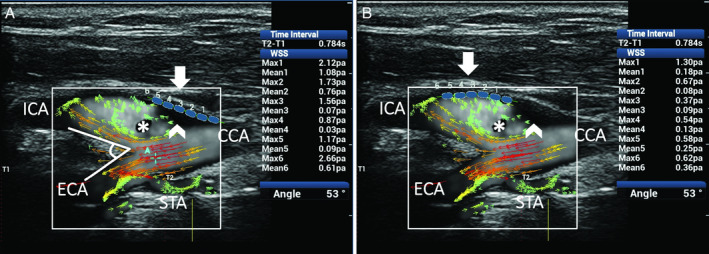
Figure 12.

Complex flow in a CB with a 53° bifurcation angle. Ultrasound vector flow imaging shows the development of complex flow due to vessel geometry and bulb–internal carotid artery (ICA) sinus dilatation. High‐velocity red vectors flowing near the divider in the ICA and a wide area of recirculation with low‐velocity green vectors moving in a counter eddy (asterisk) are shown in the outer side of the vessel. Areas in the lumen with no vector arrows and with no background speckle (asterisk and arrowhead) correspond to a flow so slow (near 0 velocity) that it cannot be detected by the system in this specific image or are not displayed because of the setting value of gain selected by the operator. Two series of 6 WSS measurements (A and B) on the outer wall (blue dots) of the bulb and ICA both gave abnormal maximum values (<1.0 Pa; range, 0.37–0.87 Pa) in 6 of 12 sample points and mean values (<0.4 Pa; range, 0.03–0.36 Pa) in 9 of 12 sample points. CCA indicates common carotid artery; ECA, external carotid artery; and STA, superior thyroid artery.
