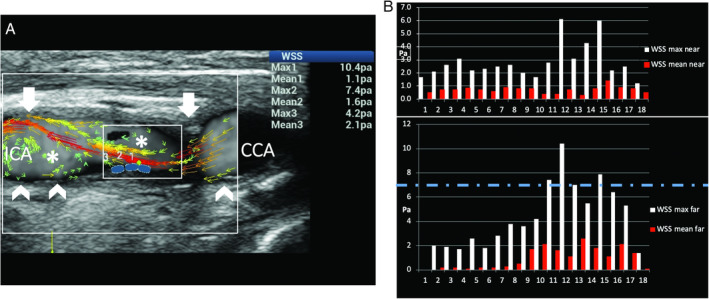
Figure 14.

Moderate carotid stenosis. A, Ultrasound vector flow imaging shows high‐velocity red vectors at the level of and distal to the stenosis (arrows), associated with turbulent flow in the poststenotic area (asterisk). B, The graphs obtained by measuring WSS point by point along the near and far vessel walls show a high WSS maximum value of 10.4 Pa (dashed line corresponds to the maximum normal value) in the poststenotic area of the far wall (blue dots on A). Abnormal values low mean WSS values (0.1–0.3 Pa) were detected at the proximal edge of the plaque (0.1 Pa) and distally (0.1–0.3 Pa) on the far wall (arrowheads on Figure A). CCA indicates common carotid artery; and ICA, internal carotid artery.
