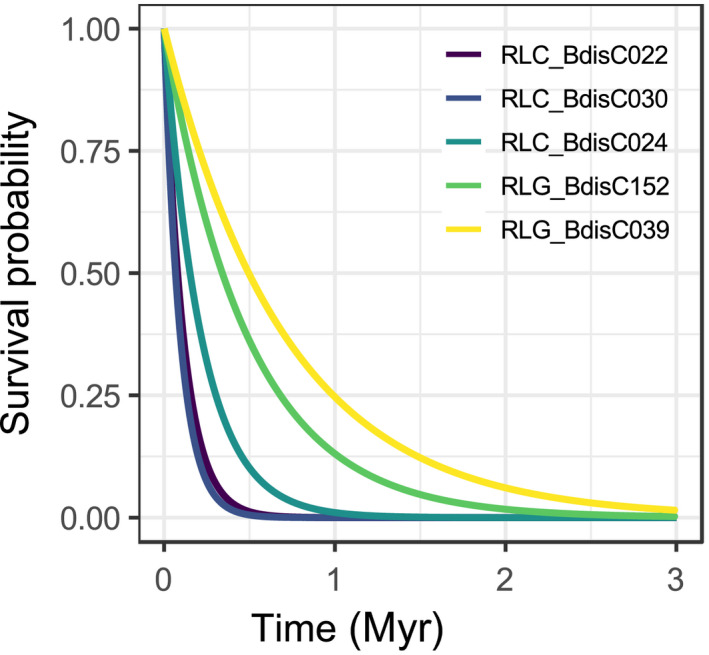
Figure 3.

Survival curves of five high copy‐number families in the Brachypodium distachyon reference accession Bd21. For each family, depicted in different colours, these graphs shows the probability (y‐axis) that a new insertion survives up to a specific age (x‐axis). The half‐life of a family, as discussed in the text, is the age up to which 50% of the insertions survive.
