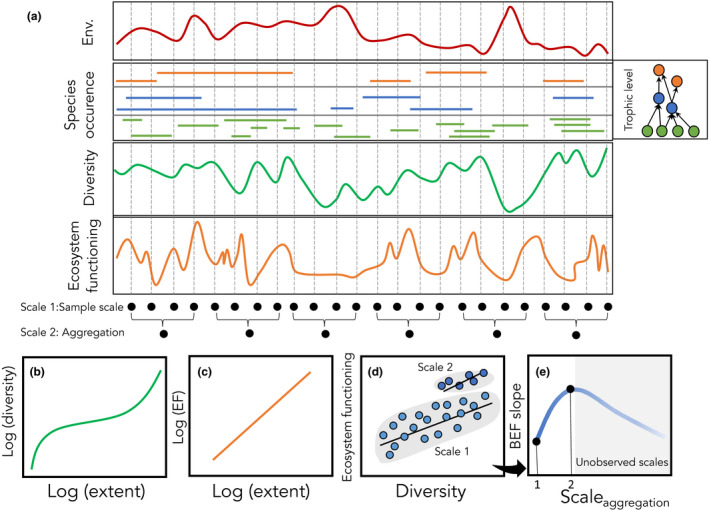
Figure 2.

The scale of observation directly affects biodiversity and ecosystem functioning but also affects the relationship between them. In panel (a) assemblages are sampled across a spatial or temporal gradient in the environment (Env), species occurrence by trophic level (with corresponding food web shown, right), diversity measured here as richness (sum of species occurring at each location) and variation in ecosystem functioning (e.g. productivity, or total community flux) arising from variable and asynchronous variation among species. These samples (scale 1) can be aggregated over space or time (scale 2). Diversity and ecosystem function each show characteristic scaling relationships with increasing spatial or temporal extent (b and c respectively), and the difference in these scaling relationships contributes to scale dependence in the BEF relationship (d) which can be projected as a BEF slope by scale plot (e). With just two scales in this example, we have only incomplete sampling of the potentially nonlinear BEF slope by scale relationship (black dots on the blue line in (e)).
