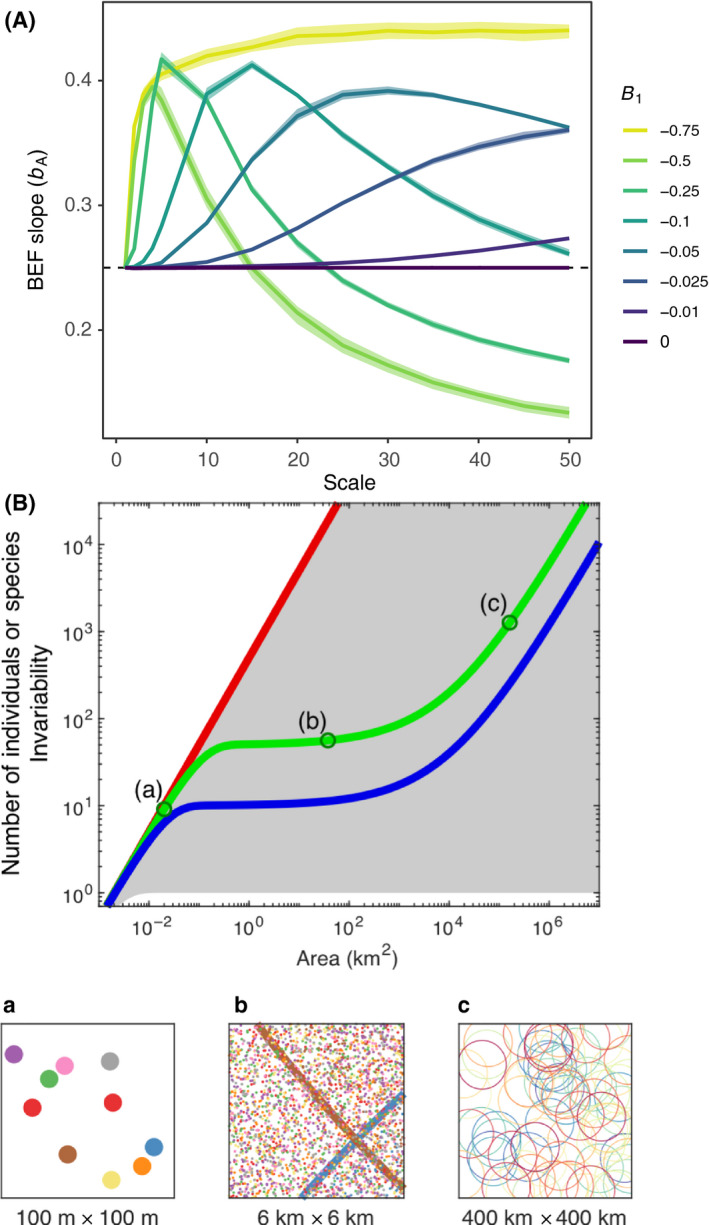
Figure 3.

Scale dependence in BEF relationships. (A) Expectations from theory on scaling of biodiversity and ecosystem functioning via aggregation across sites (redrawn after Thompson et al. 2018). The strength of biodiversity effects, bA, as measured by the slope of the BEF relationship at different spatial scales when there is incomplete compositional turnover across local patches (see main text). Different degrees of compositional turnover are indicated by the different coloured lines (low values of B1 correspond to low turnover; B1 = 0 indicates complete turnover). (B) Expectations from theory on scaling of biodiversity and ecosystem functioning with area (redrawn after Delsol et al. 2018). The green line shows the expected SAR (species‐area relationship), and a similar blue curve for the IAR (invariance‐area relationship). The grey area shows the set of possible SARs and IARs for a fixed configuration of individuals. Its upper boundary (red) coincides with the expected proportional relationship between the number of individuals and area. For SARs, this boundary corresponds to the limiting case where each individual belongs to a different species, yielding a linear SAR. For IARs, it corresponds to the limiting case where all individuals have independent productivity fluctuations, yielding a linear IAR. Productivity is expected to scale proportionally to the number of individuals, and thus to follow the same linear relationship. Bottom panels a, b and c show the distributions of individuals (a and b) and species ranges (b and c) at three spatial scales. Individuals and ranges of different species are indicated by different colours.
