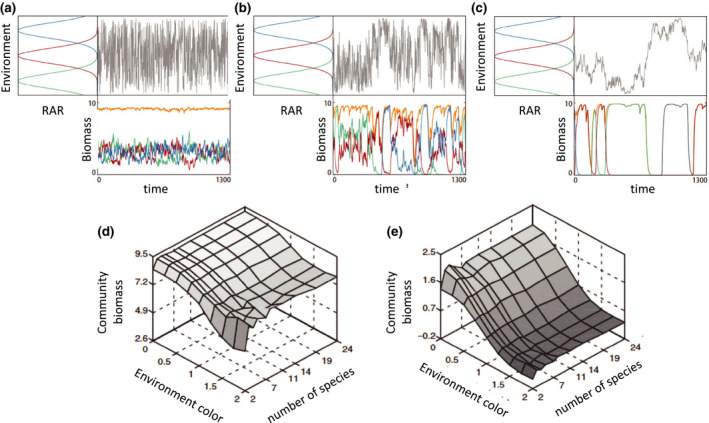
Figure 4.

Temporal environmental autocorrelation alters the scale dependence in species fluctuations, mean EF (orange line) and stability (redrawn after Gonzalez and DeFeo 2007). The top panels (a–c) show increasing autocorrelation in the environmental fluctuations (shown in grey) from left to right. RAR = Resource Assimilation Rate: (a) white noise, with no autocorrelation, (b) 1/f noise, or pink noise, where the power spectral density of the environmental fluctuations is inversely proportional to the frequencies f composing the signal. (c) 1/f 2 environmental fluctuations (red noise). The population dynamics for 3‐species resource competition showing different levels of population compensation and asynchrony over time. The species have distinct, but overlapping, environmental niches (left‐hand side of each of the top panels panel) which are shown as coloured Gaussian curves. The mean ecosystem function (orange) and species’ fluctuations are dominated by low frequency fluctuations as the environment becomes more autocorrelated (a–c). Panels (d) and (e) respectively, show how mean community biomass and community stability change as a function of species richness (2‐24 species) and the degree of autocorrelation characterised by the slope of the exponent (eight levels 0–2).
