Figure 5.

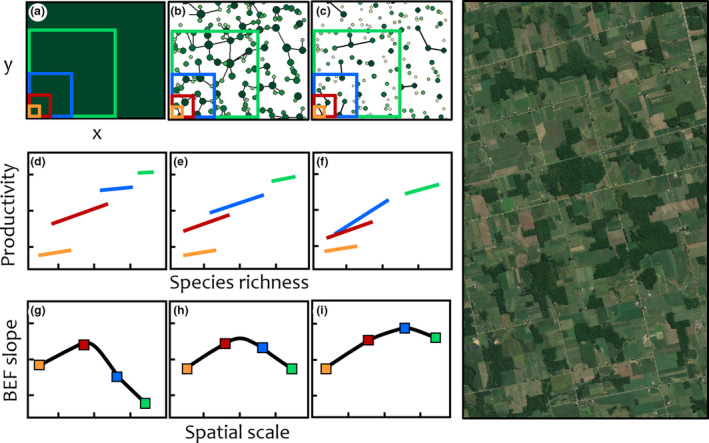
Right: Satellite image of an agricultural landscape with remnant forest fragments. Left: Predictions for the change in BEF slope as the scale of observation increases for three landscapes with varying degrees of fragmentation (simulated data). Top row: Stylised landscapes with different patterns of fragmentation of forest habitat (dark green) and surrounding agriculture (white background): (a) homogeneous forest (x = northing, y = easting), (b) fragments with varying diversity (circle size) and productivity (circle greenness), with links indicating connectivity by seed dispersal, (c) isolated fragments with lower average diversity and productivity and fewer links. At each scale of observation, denoted by the coloured sampling windows in (a–c), species richness and productivity are measured at different locations across a landscape by sliding the window. Middle row: Change in the linear relationship between species richness and productivity at different scales of observation for each landscape type (d–f). Each coloured line is composed of measurements of species richness and productivity from multiple windows at a given scale. Species richness and productivity increases with the spatial scale of observation for all three landscape types but the form of the BEF relationship varies. Bottom row: Change in the BEF slope as a function of the scale of observation for each landscape type (g–i). Each point corresponds to the value of the slope of the line of same colour in the respective above figure. At a small sampling scale (orange window in (a)) the BEF slope is low and similar in all three landscape types (orange points in (g–i). At that scale, species richness and productivity are small and not affected by fragmentation (orange lines in (d–f)). At an intermediate sampling scale (red window in (a)), the BEF slope increases in all three landscape types. At that scale, sampling windows accounted for more species richness and higher level of productivity leading to stronger BEF effects. While fragmentation has reduced both biodiversity and productivity (red lines in (d–f)), no notable impact on the BEF slope is observed at this scale (red points (h–i)). At a large sampling scale (blue) the BEF slope decreases in the homogeneous landscape (a, d, g) since most species have already been sampled producing no additional biodiversity effects on productivity. However, when fragments are isolated (c), even if species richness and productivity are lower (f), a wide range of species richness and productivity are sampled (blue line in (f)) leading to an increase in BEF slope (blue point in (i)). The effect of species turnover on the BEF slope is also observed, although to a lesser degree, in the landscape with linked fragments (b, e, h) since species turnover is reduced by the ability of species to disperse across the landscape. At the largest sampling scale (green window in a) the BEF slopes decrease in all three landscape types but at different levels (green points in (g–i)). While productivity is higher at that scale, species richness is similar in all sampling windows (green lines in (d–f)).
