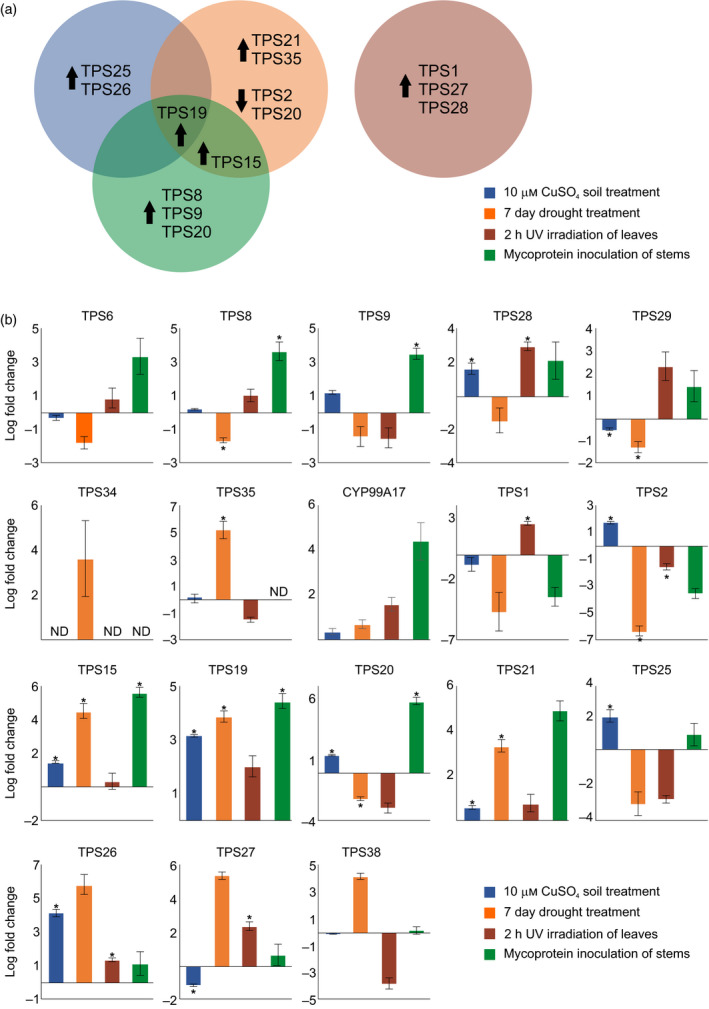
Figure 6.

Abundance of terpene synthase genes and CYP99A17 in Setaria italica.
(a) Venn diagram representation of S. italica genes significantly up‐ or downregulated by two‐fold or more in organs. Treatments included root oxidative stress (soil treatment with 10 mm CuSO4 for 48 h; blue), drought stress (seven consecutive days with relative water content = 30%; orange), leaf exposure to UV irradiation (254 nm) for 2 h (purple) and pathogen stress (approximated by stem inoculation with QuornTM mycoprotein from Fusarium venenatum; green). Transcript levels were measured by qPCR gene expression analysis with normalization to the internal reference gene SiEF‐1α (Kumar et al., 2013) using log fold‐change (ΔΔCt) compared with untreated control samples (n = 3). Statistically significant differences between treated and control samples are based on the Welch two‐sample t‐test (P < 0.05; Figure S10).
(b) Heatmap and dendrogram showing gene expression of S. italica terpene synthases (TPSs) based on publicly available transcript data (https://phytozome.jgi.doe.gov/phytomine) with red indicating high expression and blue representing low expression levels.
