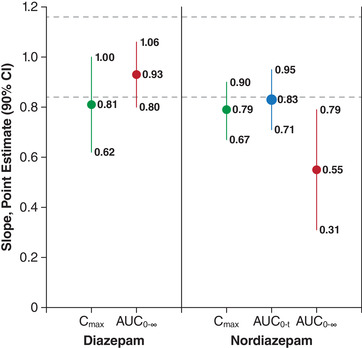
Figure 2.

Analysis of dose proportionality. Broken lines indicate the 90%CI criteria (0.84, 1.16) for meeting dose proportionality. AUC indicates area under the plasma concentration–time curve; AUC0‐t, AUC from time of dose to last measurement; AUC0–∞, AUC from time of dose extrapolated to infinity; Cmax, peak plasma concentration.
