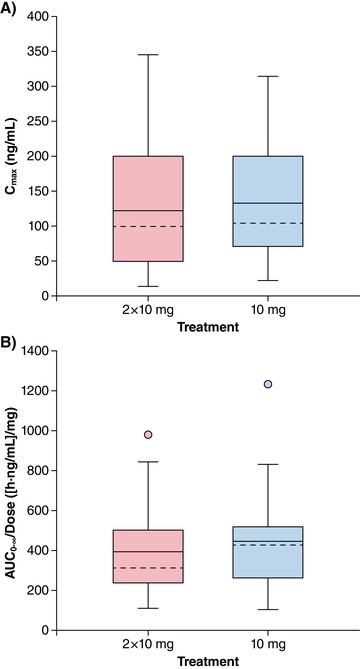
Figure 3.

Box‐and‐whisker plots of diazepam Cmax,0‐4h multiple‐dose and Cmax of single‐dose diazepam (A) and dose‐normalized AUC0–∞ multiple‐ and single‐dose (B) after intranasal administration of NRL‐1. The dashed line (‐ ‐ ‐) is the median; the solid line (–) is the arithmetic mean. The ends of the “box” (⊥) are the first and third quartiles, and the whiskers show the lowest and highest data values still within 1.5 of the interquartile range of the lower and upper quartiles, respectively. Data values that do not fall between the whiskers are plotted as markers outside of the whiskers.
