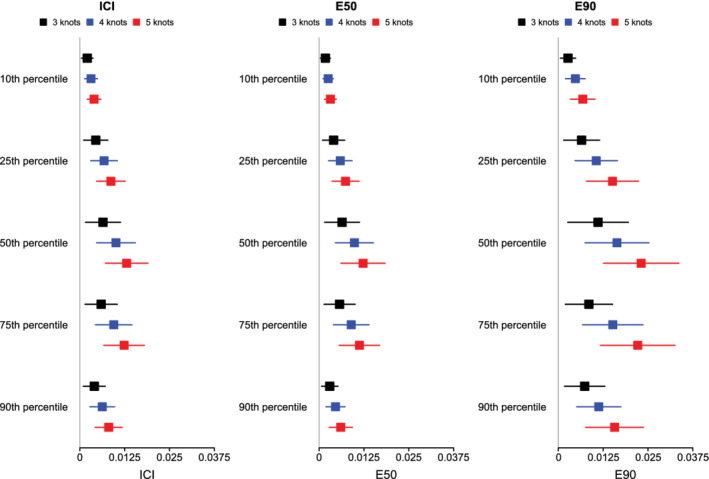
Figure 2.

ICI/E50/E90 when using RCS and different number of knots. The squares represent the mean value of ICI/E50/E90 across the 1000 simulation replicates. The error bars represent the SD of ICI/E50/E90 across the 1000 simulation replicates [Colour figure can be viewed at wileyonlinelibrary.com]
