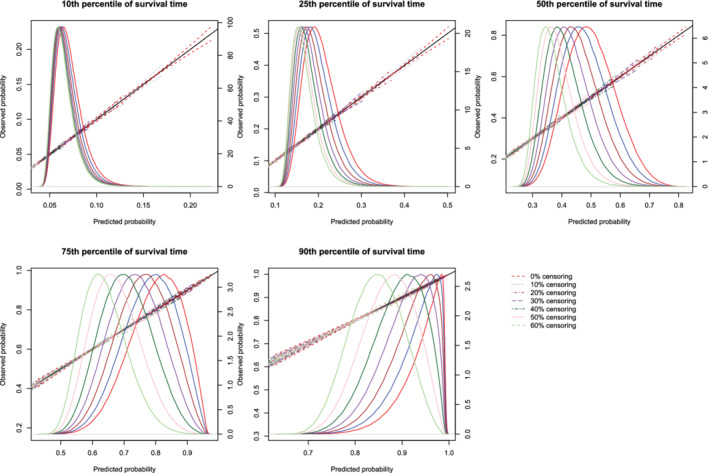
Figure 7.

Effect of degree of censoring on estimated calibration curves for different sample sizes and estimation methods. There are three curves for each of the seven degrees of censoring. The inner curve represents the mean calibration curve across the 1000 simulation replicates. The outer two curves represent the 2.5th and 97.5th percentiles of the calibration curves across the simulation replicates. The density function denotes a non‐parametric estimate of the distribution of predicted risk across the large super‐population (right axis) [Colour figure can be viewed at wileyonlinelibrary.com]
