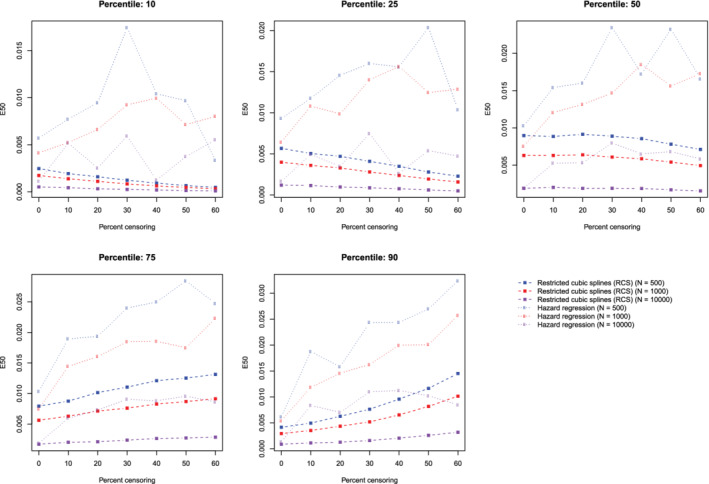
Figure 10.

Relationship between degree of censoring and estimation of E50. There is one line for each combination of sample size and estimation method. The points represent the mean E50 across the 1000 simulation replicates [Colour figure can be viewed at wileyonlinelibrary.com]
