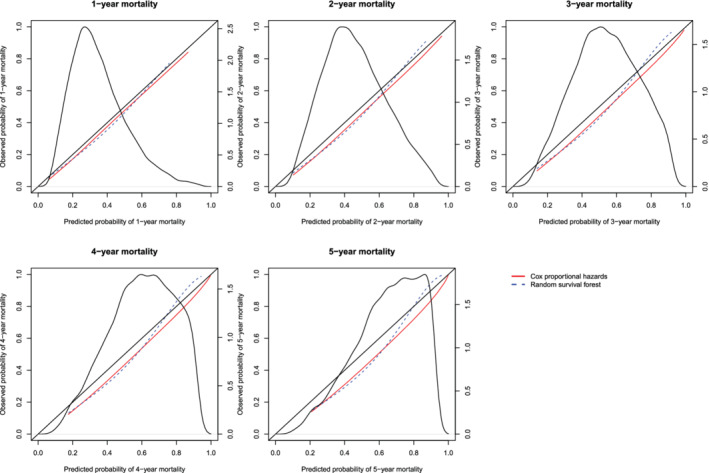
Figure 18.

Calibration curves for the Cox proportional hazard model and the random survival forest when RCS was used to construct the calibration curves. There is one curve for each of the two models. The diagonal line denotes the line of perfect calibration. The density function denotes a non‐parametric estimate of the distribution of predicted risk across the sample (right axis) [Colour figure can be viewed at wileyonlinelibrary.com]
