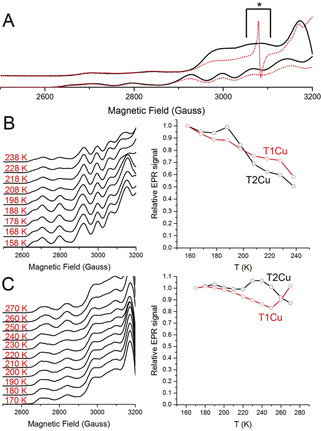
Figure 2.

T1 to T2Cu electron transfer monitored in “nitrite‐free” AxNiR and RpNiR core proteins through the cryoreduction‐EPR method. A) EPR spectra of oxidized (black, solid lines) and cryolytically reduced (red, dotted lines) AxNiR (bottom) and RpNiR core (top) proteins. Observed EPR spectra when B) AxNiR and C) RpNiR core samples were annealed (left) and changes in EPR intensities of the T1 and T2Cu sites relative to the starting signal at 158 K for AxNiR and 170 K for RpNiR core proteins, respectively (right). All EPR spectra were recorded at 20 K. During the irradiation process, many paramagnetic EPR signals are produced and the signal indicated by the black asterisk mark in the RpNiR core sample is due to the [H] radical and is formed in all the samples examined here, including both the buffer control and empty EPR quartz tubes (Figure S6).28, 29
