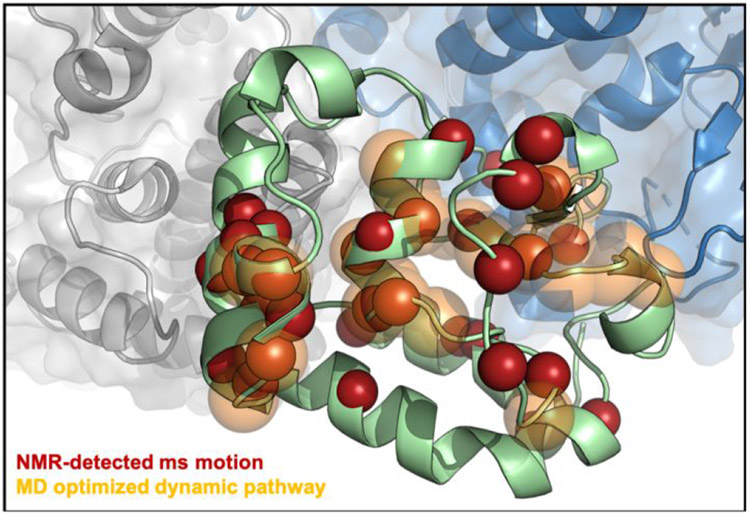
Figure 4. Allosteric signaling across HNH.
Flexible residues in the HNH construct (green) measured by CPMG relaxation dispersion NMR (red spheres) and the theoretical allosteric pathway (orange, transparent) optimizing the overall correlation between HNH residues at the RuvC (blue) and REC2 (gray) interfaces. A significant number of the sites identified by NMR are within the top 10 optimal pathways calculated from MD trajectories, suggesting that the experimentally measured dynamic pathway spanning the HNH domain correlates well with the computationally derived pathway for optimal information transfer.

