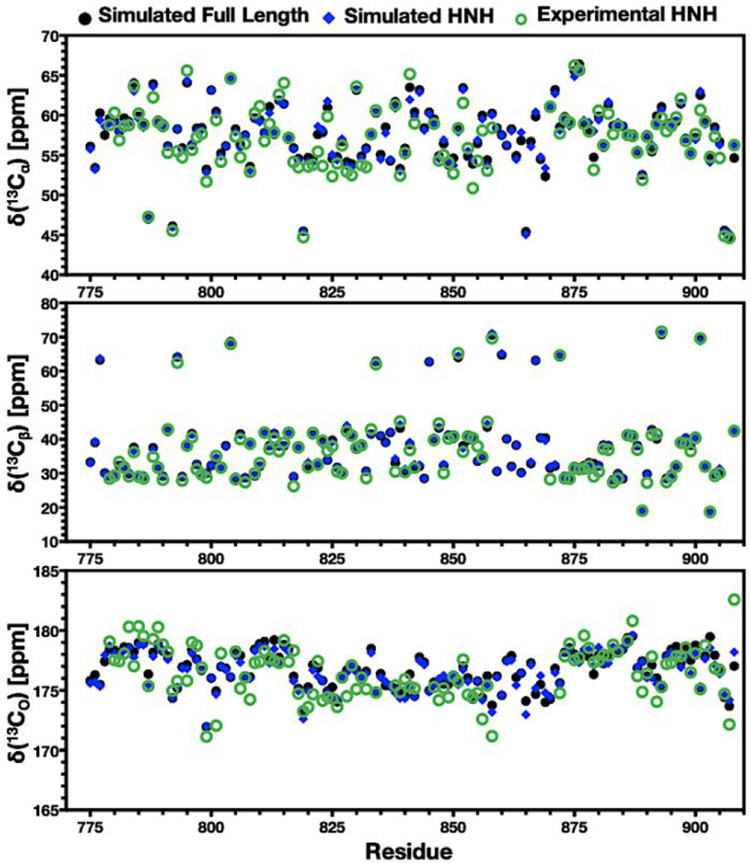
Figure 5.
Experimental vs. simulated carbon chemical shifts. Experimental and simulated NMR chemical shifts of 13Cα (top), 13Cβ (center), and 13CO (bottom) plotted for each residue in the HNH domain. Data in each plot compare the experimental chemical shifts (green circles) with those calculated from simulations of the isolated HNH domain (blue diamonds) and of the full-length Cas9 complex (black circles). All simulated spectra were computed as described in Methods utilizing GaMD trajectories.

