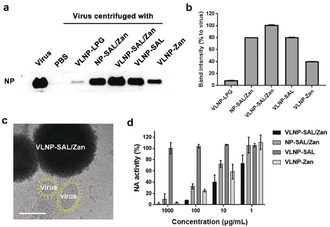
Figure 2.

a) Western blot of influenza nucleoprotein (NP) that reveals viral binding to the nanoparticles.b) Band‐intensity analysis for the western blot in (a). c) Cryo‐EM images for virus binding to VLNP‐SAL/Zan. The virus is marked yellow for a better view. Images without marks are shown in Figure S5. Scale Bar: 100 nm. d) Inhibition of NA activity by the nano‐inhibitors. Values are expressed by mean±SD, n=4.
